Regional, niche events are a data collection resource, says VenuIQ. In a newly-published guide, the company argues that smaller events are a data-harvesting opportunity that should inform how organisers run big, flagship events.
The guide lists the main data-gathering points that organisers should focus on. These are split into pre-event, onsite engagement and post-event.
Pre-event data points
- Website and registration (where are people dropping off, which registration fields are most useful)
- Marketing performance (compare email, PPC, social and partner source channels for driving sign-ups, look at which channels pull execs versus first-time attendees)
- Agenda structure (look at attendance for different formats, match session timing to check-in and drop-off rates)
- Audience demographics (segment who shows up, and identify which segments are most engaged)
These signals can be used to refine pricing, reshape agendas and decide which audiences to prioritise before scaling a format to a national or international event.
Onsite data points
- Session attendance (did attendees go to what they booked, and what time slots worked best)
- Networking activity (who’s meeting who, are curated meetings being used, where is networking happening)
- Sponsor and floor engagement (which booths saw the most activity, which attendee segments showed the most interest)
Tracking movement and dwell time allows organisers to redesign floorplans, reposition sponsor activations and prove sponsor ROI using actual traffic rather than post-event estimates.
Heatmaps can also identify congestion points and underused areas, helping organisers adjust layouts for future editions and improve visitor flow.
Post-event data points
- Survey feedback vs behaviour (did feedback match what people actually did)
- Rebooking signals (which sponsors are most likely to return, which attendee segments are likely to convert again)
- Aggregated learnings (what trends repeated across regionals, what didn’t scale well)
Post-event analysis can also highlight where costs can be reduced. Some organisers have reportedly cut future catering spend by more than half after analysing when and where delegates actually used food and beverage areas.
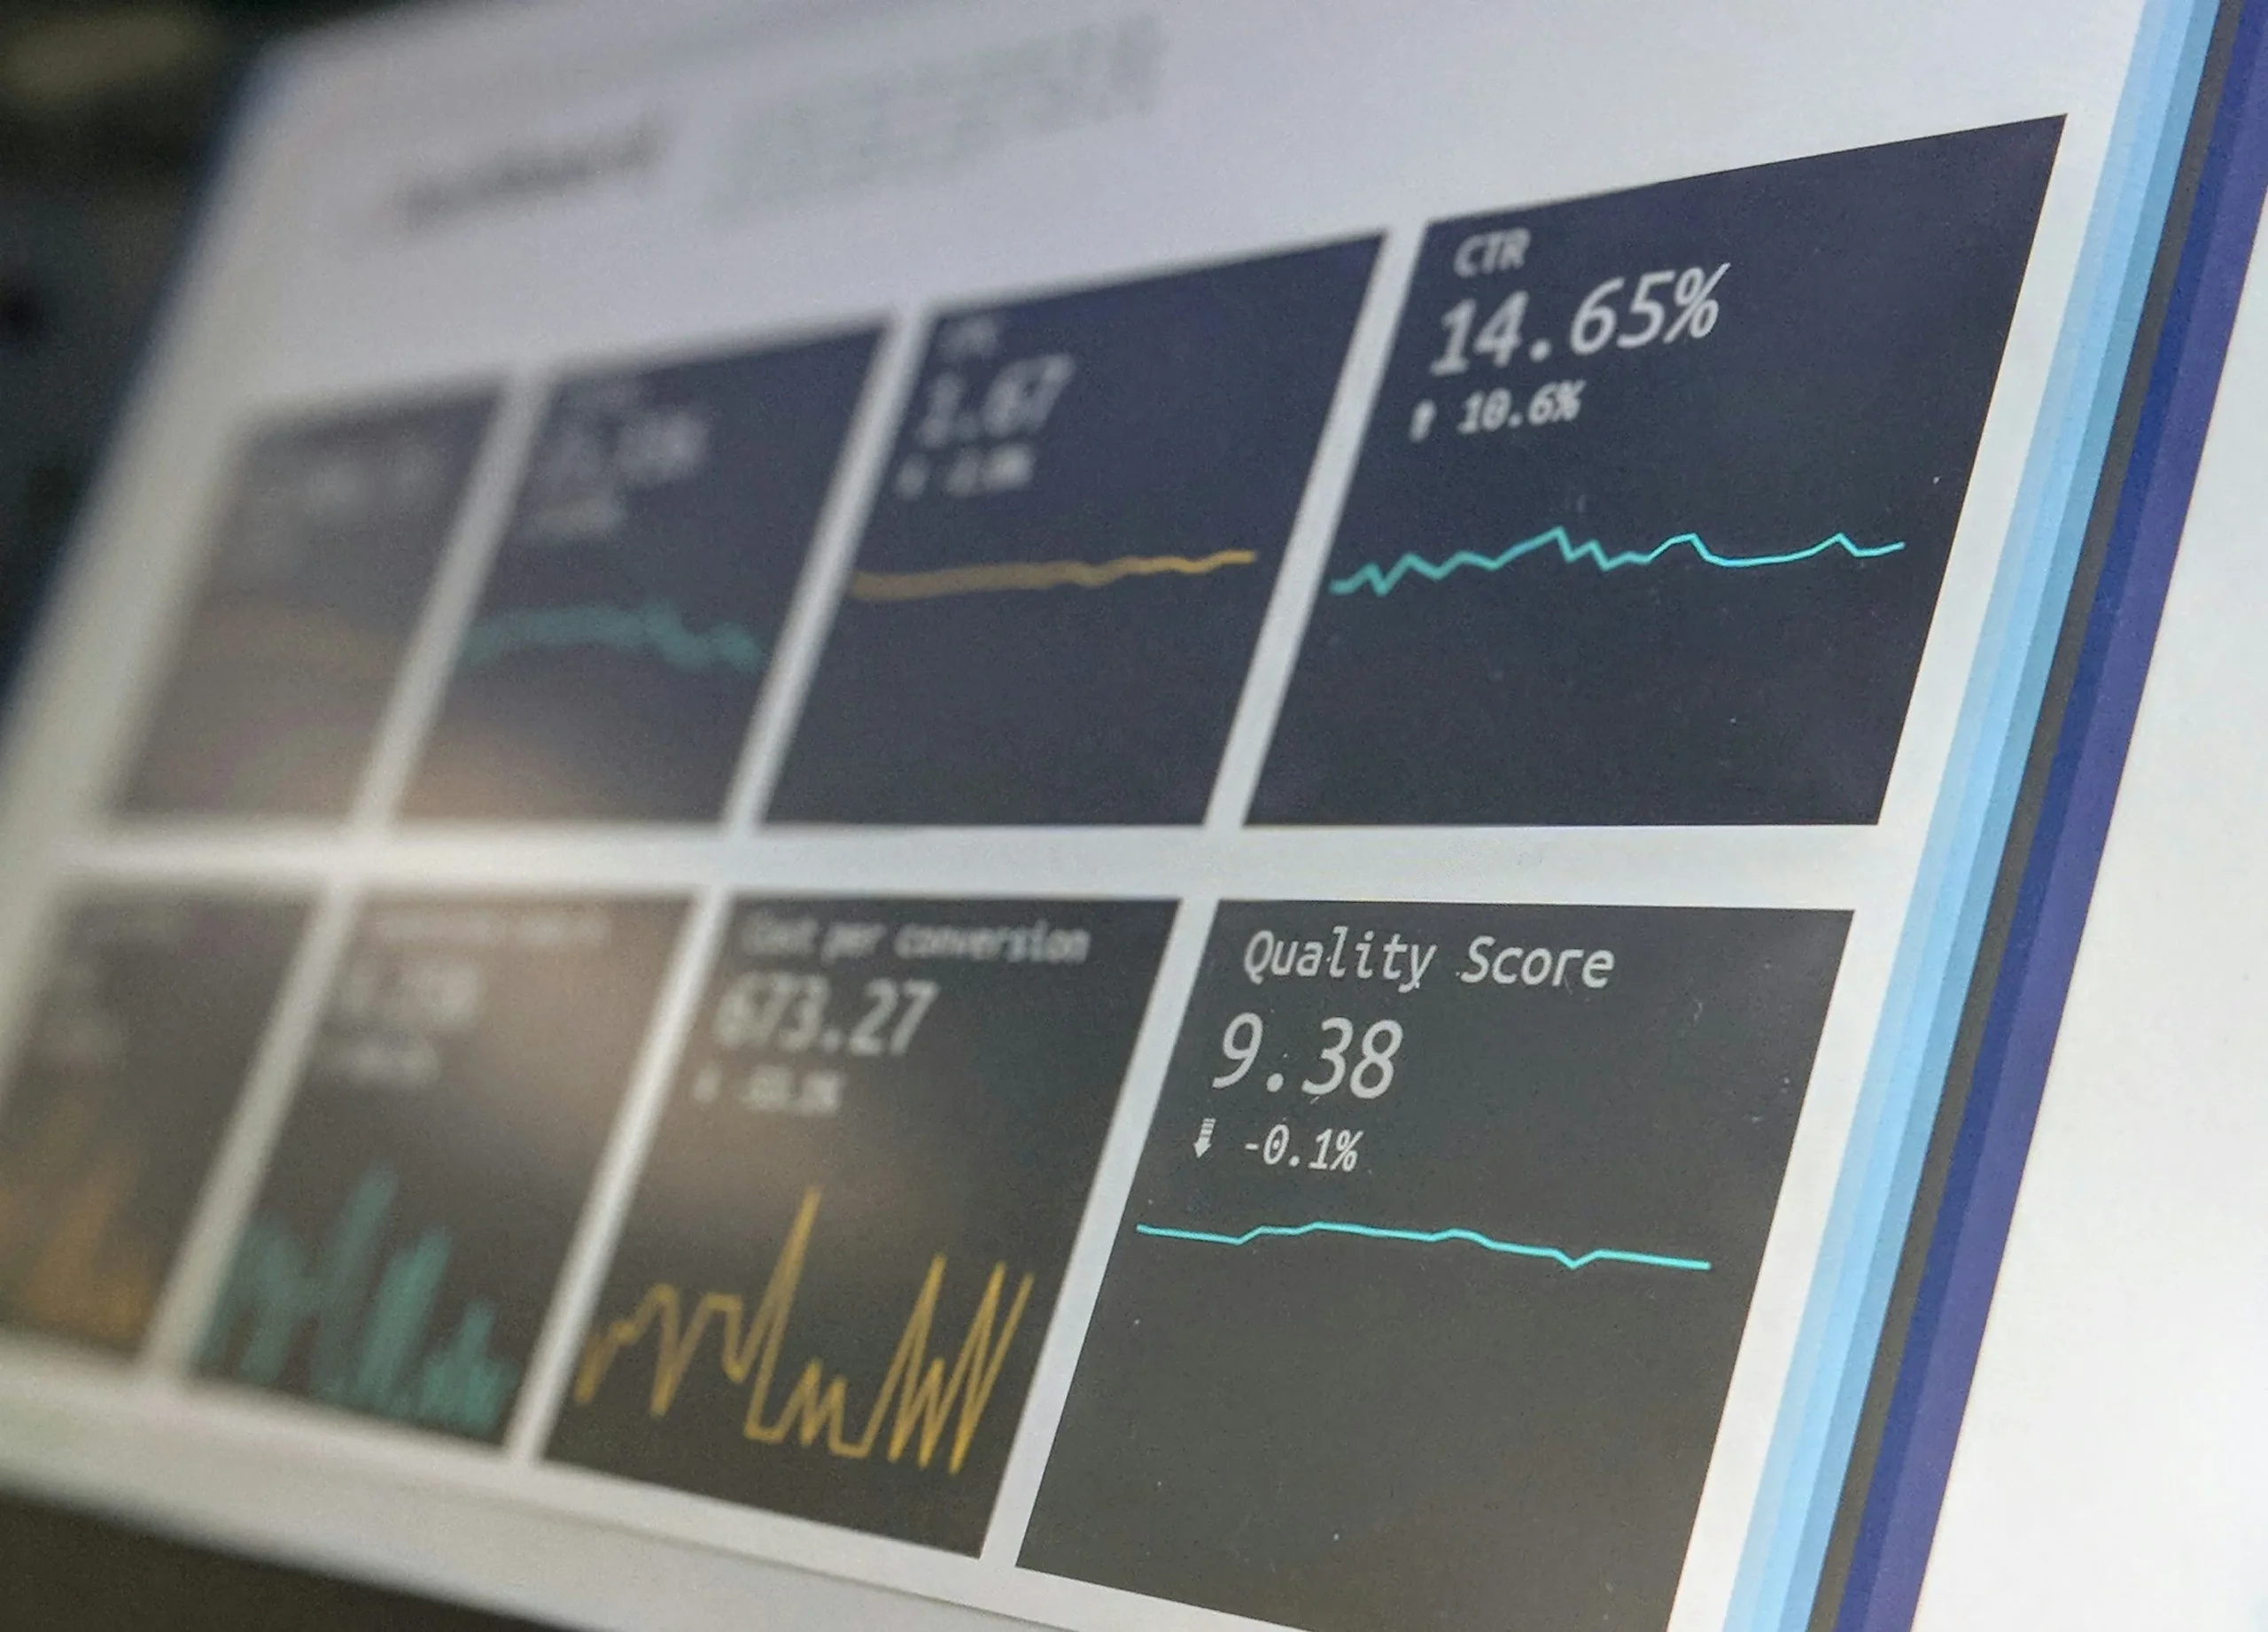
The guide contains a “cheat sheet” of what specific data points to use for each task. For example, for structuring the event website (pre-event), VenuIQ recommends page visits, drop-off rates and CTA clicks. It also suggests what tool to use for this – for structuring your website, it lists CMS system and Google Analytics.