

CloserStill Media and Nineteen Group chairman Phil Soar deep dives into the detail of EIA’s Size and Scale Index for Exhibitions 2024
The annual SASiE report is now the only valuable source of information about what is happening to the exhibitions industry in the United Kingdom. It involves an enormous amount of work and data gathering, and it tells us much which is valuable and often intriguing. But, having said that, clear analysis in changing times is not straightforward.
At first blush, the 2024 SASiE report is encouraging. There was a large increase in the total number of exhibitions reported by UK venues and this number is as high as any since the SASiE report began in 2015 – we now have a decade of numbers.

Overall, 2024 has seen very real improvements over 2023.
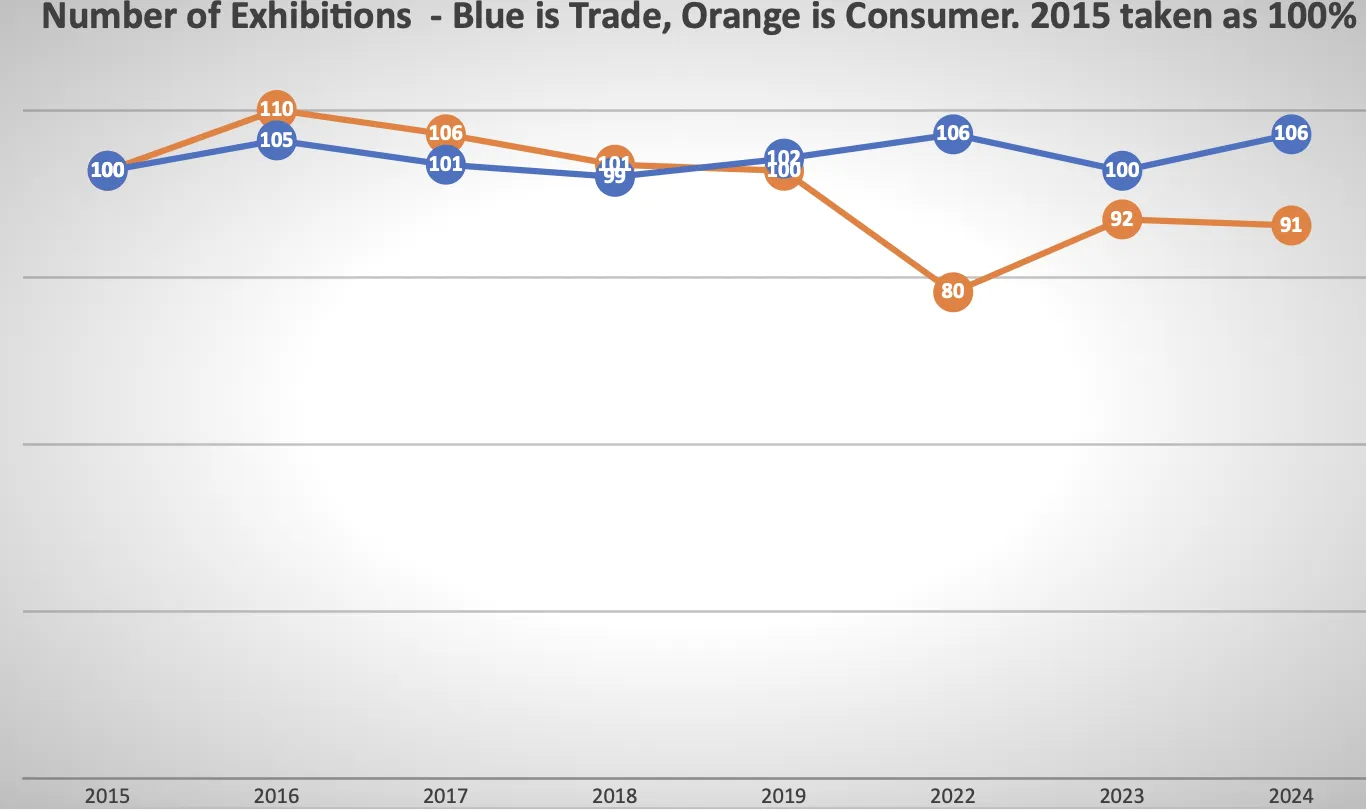
- Like for like, we saw circa 4% more exhibitions recorded – with 6% more trade shows (trade shows represent 75% of our industry’s revenues).
- From the venue viewpoint, average gross size of shows was 5% higher.
- Total visitor numbers at the four largest venues were up 3%-4% year-on-year.
- And the total number of exhibiting companies was up 11%.
Perhaps the single most encouraging finding is that trade show attendances have been steadily rising since 2022 and are now only 3% below their level in 2015. This is within the margin of error and attendances in 2016 were pretty well exactly the same as in 2024 – having withstood the twin headwinds of Brexit and Covid.
Having said that, according to the report, the number of exhibiting companies at UK events is still 22% below the equivalent number for 2015. For reasons I cannot easily explain, I am sceptical of this number. The fall just seems too large. But of course, the disastrous Brexit vote was in 2016 and there is not the slightest doubt that this political absurdity seriously damaged our industry.
From the perspective of our venues, average gross size and exhibitor numbers were all up in 2024. This is an encouraging trend after five difficult years. But the average gross exhibition size (i.e. the amount leased by the venue to the organiser) is still 13% below the 2015 figure. However, this is the “average” and should be taken with a large pinch of salt – see the caveats below.
The analytical problem is the ‘Confexs’
Confexs are basically conferences with a small amount of exhibition space attached. Historically, around 10%-13% of the events we analyse could be described as Confexs – in 2022 for instance, they represented only 9% of the events covered. But in 2024, SASiE has added more venues to its data and this appears to have led to an apparent surge in the number of Confexs.
Out of 1,145 reported events in 2024, 25% are confexs – and while we are reporting 6% more trade shows in 2024 than in 2015, and 9% fewer consumer shows, somehow there are 117% more confexs. I don’t believe this. What must be happening is that we are seeing confexs being included in the 2024 report which already existed, but were simply not being reported, in earlier years.
In addition, confexs are included if they have just 500 sqm of (gross) space – whereas traditionally we have only included trade and consumer events if they have at least 1,000 sqm (and, before 2014, 2,000 sqm). Of the 282 confexs included, less than 10% run in the traditional four biggest venues, while the profile of their content is very different from the rest of our events – only 1% of confexs were in the broad leisure sector, compared with 25% of trade/consumer shows, while 27% of confexs were in the medical/health sector, compared with just 9% of the trade and consumer shows.
Confexs had on average just 40 exhibitors (meaning that it is probable at least half had even less) – while trade exhibitions averaged 153.
Plus, confexs averaged less than 1,000 visitors/attendees – whereas the average attendance for trade/consumer shows was just over 8,000 (the median is less, circa 4,500).
I stress, this does not mean there is anything wrong with the SASiE data – anything but. But, in trying to analyse trends in our industry, we are sometimes in danger of comparing apples with pears with a few oranges thrown in.
Now for the caveats
Just as big a challenge in analysing these numbers is that the total number of exhibitions changes rapidly. In the past two years, the total number of events reported has risen by 18%. The key word is reported, rather than run. I doubt that there are now six exhibitions for every five a couple of years ago (and rather more than in 2019 as well) – SASiE, to its credit, is gradually casting its net wider.
In fact, the “increase” in the total number of exhibitions reported between 2015 and 2024 (up 9%) is entirely due to the increase in these smaller “confexs”.
In addition, there is the obvious statistical problem with any “new” events. Almost by definition these are bound to be small. On top of that, it is reasonable to assume that we did not see many new events in the 2019-2022 period for Covid reasons.
Given that the bigger events are largely still with us (our top 50 shows, never forget, represent some 75% of our whole industry turnover), then even if all the larger events are static or a tiny bit larger, then 100 (say) smaller new events will inevitably reduce the average size and attendance across the whole database of shows.
Therefore, to take one simple but mathematically clear example, SASiE tells us that the total number of visitors to events has risen by 3% between 2023 and 2024, but the average number of visitors per show has fallen 4%.
To perhaps tediously illustrate the point, assume that four senior execs from one of our fine companies are sitting in a bar. They each earn £100,000. So their average salary is £100,000. They are then joined by two marketing managers who earn £40,000 each. What is now the average salary of our employees in the bar? £480,000 divided by 6 = £80,000. Hence the average salary of the company employees has fallen 20% – from £100,000 to £80,000. All of this is true but it tells us nothing of any value.
In times gone by
In the good old days – say from 1990 to circa 2012 – we used to analyse all the information like for like. In other words, we would compare this year’s shows with the same shows which ran the previous year. Overall, the number of square metres and visitors may be rising, but taking only the shows which ran in both years, we might find that visitor numbers were down like for like.
This is no longer easily available, as the information which the venues provide is not granular enough, added to which since around 2012 organisers have been increasingly reluctant to give out accurate visitor numbers.
ABC only audits circa a dozen shows nowadays, compared with 150 in 2008. This is, of course, because overall visitor numbers have slowly been in overall decline and organisers are not keen on saying anything they don’t need to say. (In the last 30 years, overall visitor numbers have been falling at an average rate of about 1.2% per annum: net square metres have fallen at about 1% per annum). Unlike members of the Newspaper Association, we aren’t under any obligation to give out the numbers.
It is consumer shows that account for the visitor decline
Crucially, almost all of this decline has been in consumer shows. While consumer shows still represent 62% of all attendees at UK shows, their overall attendance has dropped by almost a third over the last decade.
By comparison, trade show attendance is almost back to where it was in 2015 – being just 3% lower. For trade show organisers – the bulk of our industry – this is one of the most encouraging of SASiE’s findings but reinforces what the venues know – that it is the consumer shows which have borne the brunt of any declines in the past decade.
I can imagine some readers being confused about sets of numbers, which might seem internally contradictory. To explain a little further. Consumer shows in 2024 (of which there were 277) attracted an average of 11,600 visitors. In total 62% of visitors to all UK exhibitions went to consumer shows.
Trade shows (of which there were 480) only attracted 29% of all UK visitors, with an average attendance of 2,400 – barely one fifth of the average consumer show.
The first graph below – TOTAL VISITOR NUMBERS 2015-2024 – shows very clear trends. 2015 is taken as 100% and each subsequent year is taken as a percentage of 2015. The good news is that, overall, trade shows have returned to the level of attendance of 10 years ago – being just 3% short of the 2015 number.
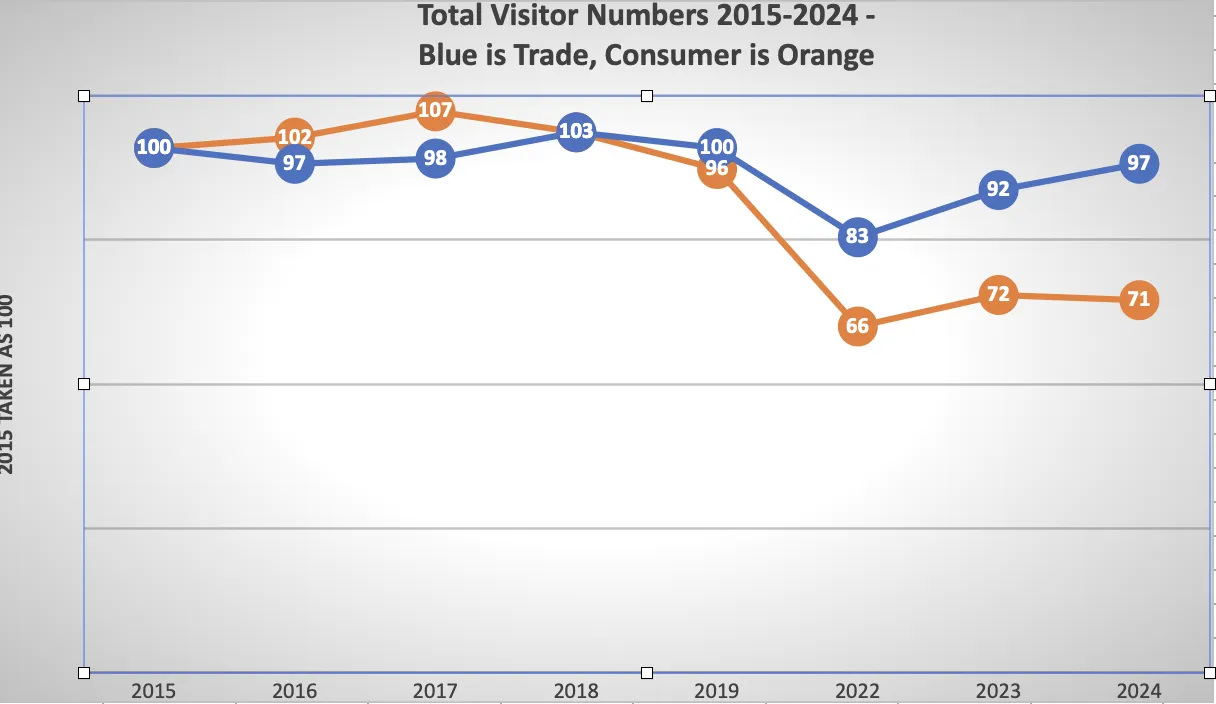
But on the downside, consumer shows overall a continuing decline from a peak in 2017. Indeed, between 2017 and 2024 consumer shows appear to have lost, overall, 34% of their visitors. The post covid drop in 2022 is clear, but while the same happened with trade we see that trade shows recovered quickly while consumer shows have failed to do so.
The second Graph below – TOTAL NUMBER OF EXHIBITORS – is clear. According to SASiE, we have lost some 22% of all our exhibitors in the past 10 years. The Brexit effect was not obvious in 2016 and 2017 as most trade shows rebook ahead, so the hit came in 2018 and we have struggled to recover since.
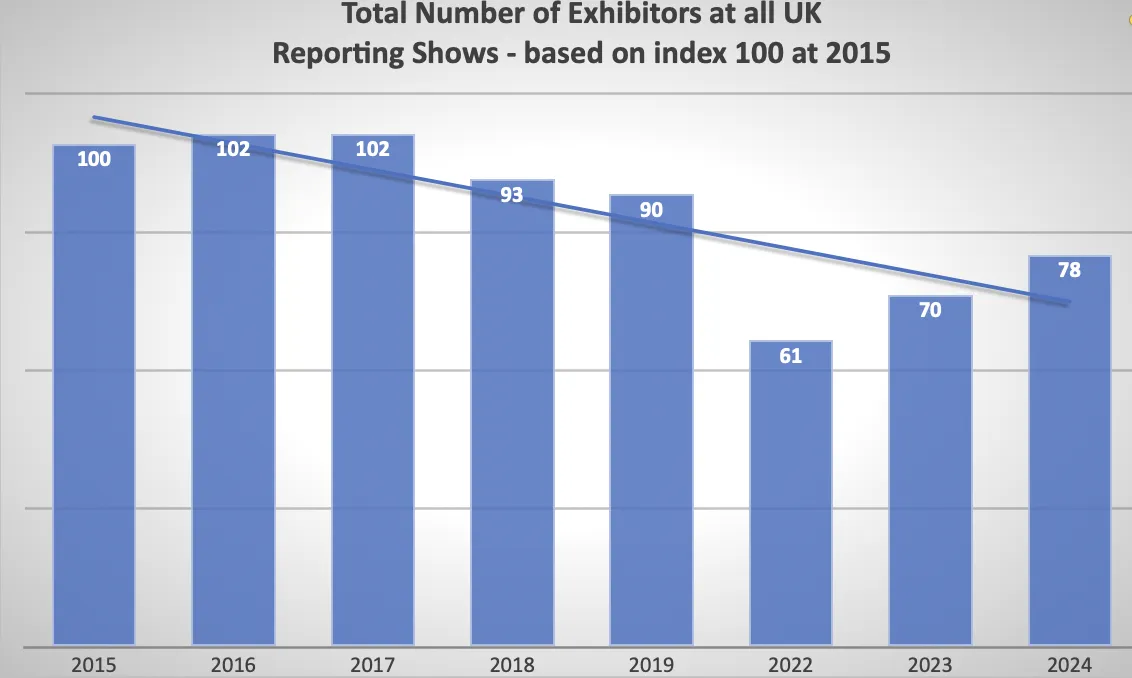
On the good news side, though, from 2022 to 2024 we see a clear recovery, with 2024 running at 28% above 2022 in terms of total number of exhibitors.
Watch out for survivor bias
The third Graph below – shows GROSS SPACE SOLD BY VENUES. The blue line on the graph is encouraging – there has been a 25% increase in gross sqm sold by the venues in the past two years, even though that number is still 10% below the figure for 2015.
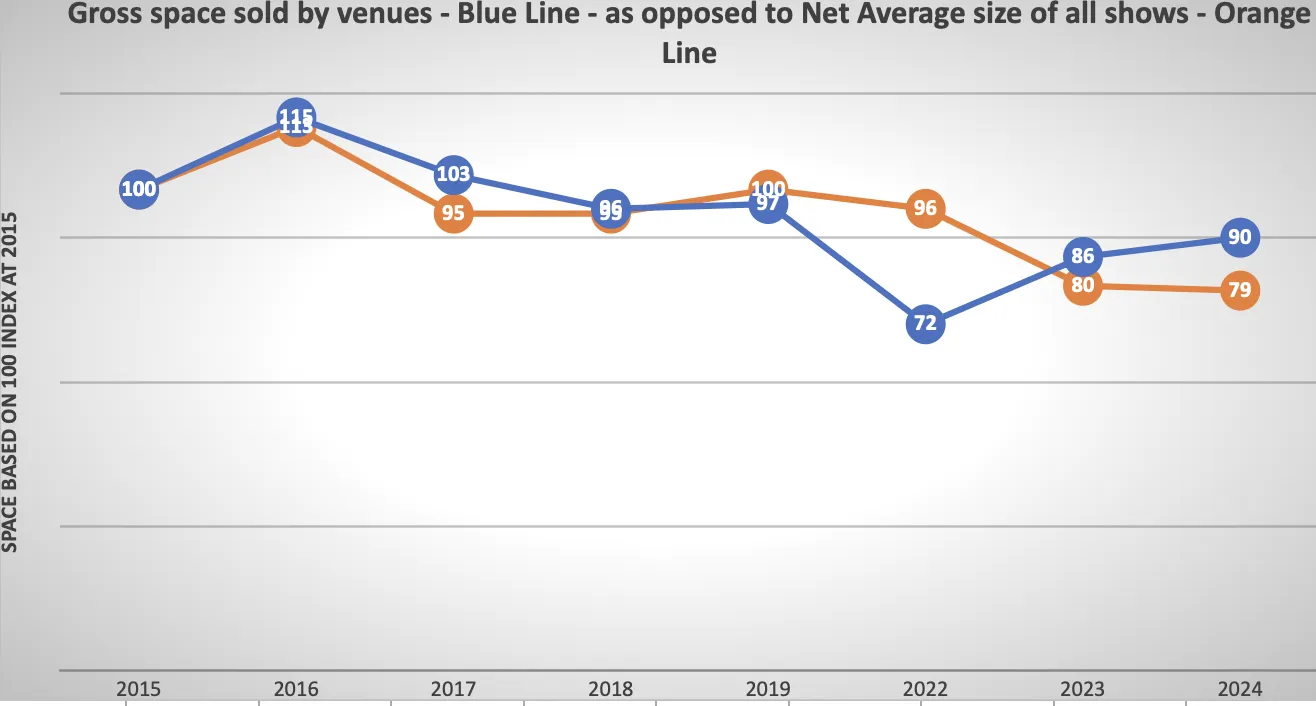
The orange line shows net average size of all shows, and this tells a slightly different story.
Net Show Size seemed to stay reasonably steady up to 2022, but in the past two years has dropped by 21% compared with the immediate pre-Covid year of 2019. Read this as you will – personally I think it is a result of SASiE introducing so many small “confexs” into the mix.
Added to which, there is survivor bias here. Shows which drop out year on year are likely to be small, while the bigger shows continue. This does not mean that the typical show is the same size, merely that the loss of the smaller shows boosts the “average”. It is perfectly possible that ALL existing shows were getting smaller in 2019 compared with 2018, but because the very small ones dropped out, the “average” stayed the same.
If you don’t believe me, try this.
In 2018 a company had five shows – 5,000 sqm, 4,000 sqm, 3,000 sqm, 2,000 sqm and 1,000 sqm. Thus the average size of their shows was 3,000 sqm.
In 2019 the 1,000 sqm shows collapses, dies and doesn’t run. The other four shows all lose 500 sqm each – hence they are 4,500, 3,500, 2,500 and 1,500.
So what is the average size in 2019? – exactly the same, 3,000 sqm. So the statistician concludes that nothing has changed and that our shows are all running at the same size year on year. But the reality is that every show has LOST 500 sqm and the smallest one has died a death. This is called “survivor bias”.
This is a small example, but it does show how carefully this sort of material has to be handled.
The fourth graph below shows the total number of trade and xonsumer exhibitions each year – with trade shows running 6% above 2015 and xonsumer shows 9% below.
Overall, the SASiE report is encouraging. 2024 was a year of solid recovery and, anecdotally, 2025 is also going well. Let’s see how the Trump trade reset affects us in 2026.