

EN guest editor Phil Soar looks at the Size and Scale Index of Events (SASiE) and says the report is invaluable in looking at the impact of the past seven years on exhibitions as well as looking to the future.
This week the AEV published their SASiE report on the industry in 2022. This is an excellent major research programme, under the direction of Rachel Parker (director of the AEV), Tony Rogers and Richard Smith. If you want an insight into what is going on in our industry, there is no better (or indeed other) source – and Rachel has not been able to publish since 2019. They must be heartily congratulated on being able to form a comprehensive view on 2022 despite the chaos of the past three years.
I don’t want to cover any of their very detailed findings – that would be inappropriate – but wanted to look at one of the keys areas – what are the trend lines which we might observe about the last decade.
But a few titbits to encourage everyone to delve deeper into the report
- There are 969 recognised exhibitions in the UK, by chance exactly the same number as in 1999 when the AEO first tried to synthesise statistics. So that is a healthy sign.
- Only half of all exhibitions now say they are annual – the rest are presumably biannual or biennial, and this may be affected by the uncertainty of 2022.
- The net to gross ratio is 52% – somewhat higher than a decade ago.
- The biggest single number of trade events is in the medical/health sector (14.5%), thus no longer leisure, lifestyle, giftware sector.
- 41% of all exhibitions take place in the three months of March, October and November.
Looking at the trends of the last decade
I appreciate that not everyone shares my obsession with graphing anything that moves but this graph shows the trend in total space booked at recognised venues by organisers. In other words, it is gross space. The report is compiled for the AEV, so from the venue point of view, gross space is more important than net space.
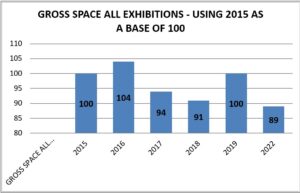
SASiE began in 2015 so that year is taken as their base year. (I will come back to this rather critical point). Every other year is, therefore, essentially a percentage of the total space booked in 2015. The graph suggests a downward trend but 2022 is “too early to judge”. In 2022 89% of 2015 is almost certain to be an underestimate of real demand. In 2022 many organisers were naturally cautious as they had, in some cases, not run an event for 3 years. So they are likely to have been pessimistic rather than optimistic and kept expectations subdued. Given the broad (if totally un-mathematical) view that 2022 was running at roughly 85% of 2019, then I would expect the real number to be around 94-96% in 2023. Nonetheless, it is clear that the broad trend line is as best flat and probably declining at a rate of around 1% per annum since 2015.
How many companies are exhibiting at our shows?
Logically one would expect the number of exhibiting companies and the total space booked to follow pretty much the same trend lines. This is exactly what we see here.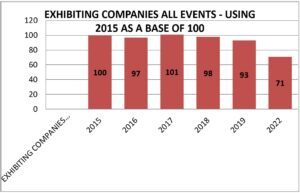
The 71% number of 2022 is worrying and it does not accord with much anecdotal evidence. The only numbers I know for certain are the 60 or so shows run by my own companies, where post-covid exhibitor response was more solid than visitor and delegate response (exhibitors seemed less worried about travel post-Covid).
But I would apply the same comments as to space booked. That 2023 will see a big increase on 2022 but that there is a slow but perceptible decline of around 1-1.5% a year in the past 7 or 8 years.
The problem with using 2015 as a base
The use of 2015 is perhaps the biggest difficulty in interpreting all of these findings.
SASiE has to use 2015 because that was the year that the research programme was introduced and, as the numbers and techniques have to be like-for-like, year-on-year, then 2015 has to be their base. They cannot look back beyond that into deep space.
Having said that, simply using 2016 as the base would make the SASiE numbers look rather different and open to differing interpretations. Have a look at the graphs. With 2016 as the first and base year, the following years’ gross space would look far worse and visitor numbers far better – solely because of moving the base year by 12 months (this is a excellent example of the problems of interpreting statistics).
The reason I think 2015 is a problem is that all the numbers suggest that it was the top of the cycle which ran from the financial crisis of 2009 to the post Brexit declines of 2019. What happened from 2020-2022 is obviously outside the normal cycle.
This cannot be proven because the SASiE research takes a mass of like-for-like comparisons which cannot be exactly matched with any pre-2015 analysis.
Nonetheless, we do have broad trend numbers back to 1985 and I have taken simply the Visitor numbers to trade shows from 2010-2014 (from my AEO research) and then matched them against the overall SASiE number for 2015. You can see this in simple form here. 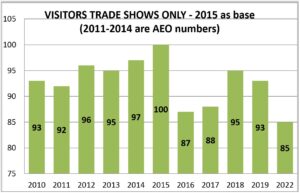
What it tells us is that visitor numbers gradually increased post the 2009 financial crisis and seem to have reached a peak in 2015 (I cannot explain the apparent large drop in 2016).
One key conclusion – we are holding our own
For every 100 visitors in 2015, there seem to have been around 93 in 2010. And there also seem to have been around 93 by the time we reach 2019. I don’t think 2022 tells us very much at this point – there will be a rebound in 2023, though to where cannot be certain.
It is interesting that in both visitor numbers and square metres booked, the overall numbers for 2019 are very similar to the numbers for 2010. So, unlike say newspapers or magazines, we have not declined at all in the last decade. Thus it is possible to interpret all this information rather positively. Despite a decade or so of massive change (not least in the web and social media) we have held our own. This is rather a cheering thought.
We were in a benign positive cycle to 2015
I have made the same comparisons (as best I can) with visitors and gross and net square metres and the figures generate the same conclusion.
This is that our industry was in a positive, benign cycle after 2009 for about six years, and then slowly started to retreat from 2015 onwards. The question is why?
It is perfectly possible that this is a normal short cycle which reaches a peak and then decline. That does not portend what will happen next. History says it is very dangerous to make predictions, particularly about the future – look how vinyl records have returned, or the collapse of Facebook (Meta) shares.
But it is also likely that our dear friend Brexit has had a major part to play. I say this because similar graphs for France, Germany, Spain and the US do not show similar patterns. They do not rise to a peak in 2015 and then suffer relatively sharp declines. After the 2016 vote there was been a palpable loss of confidence in the UK’s economic prospects (maybe not in Stoke on Trent, but that’s not where the key investment decisions are made – they can write what they like on their buses in Stoke). It continues today. The UK is the only G20 economy which is still below its 2019 levels. It is the only economy which will decline in 2023 (even Russia will grow). Average family spending power will collapse by 6% in the next two years – the biggest fall ever recorded.
I think this is clear from these graphs. The gross space number for 2016 is a particular clincher. It is 4% higher than in 2015, then suffers a dramatic fall of 10% in 2017. This fits the hypothesis perfectly. We are a slow cycle business. Organisers in 2015 booked their 2016 venue contracts on the back of a good 2015. But in 2016 the mood had changed and many companies pulled back for 2017 out of a deep (and justified) sense of uncertainty.
That being said, I think the general trend of visitor numbers is similar to that of the other graphs – a slow fall of perhaps 1% a year from 2015 to 2023 (and which assumes a good 2023 rebound).
Are there any conclusions?
- The SASiE report is invaluable. It is currently the only independent tool we have which examines broad trends in our industry.
- Our industry was progressing very positively through to 2016 and, based on other European countries, could have been expected to do so.
- Since 2o15 we seem to have seen a reasonably consistent decline in square metres booked, the number of companies which exhibit at our events and the number of visitors which attend them. I would judge this to be around 1-1.5% per annum. Given that the trade show business in the UK is large and can be expected to reflect accurately the state of the economy and the country, then none of this should be a surprise. Covid makes it impossible to produce useful numbers for the past three years, but we currently have an economy which is flat, or perhaps in a slight decline, and where investment is falling. Logically, therefore, our industry in its totality (NOT show by show) might expect the same.
- In terms of square metres and visitors the industry seems broadly to be where it was in 2010 – overall it appears to have held its own in that period.
- The industry is recovering extremely well from Covid. We have shown ourselves to be enormously resilient against (probably) the worst which can be thrown against us. I have anecdotal and published information from all seven of the UK’s largest trade show groups. On average they are looking at 2023 being 16% ahead of 2019 in terms of net profit. Whether we will see a clear reversal of the trends of 2015-2019 post near normal in 2023 is going to be interesting to observe.