

If ”state of the industry’ reports don’t account for inflation, how can they be relied on as accurate year-on-year analysis, asks CloserStill and Nineteen Group chairman Phil Soar
Our industry is notoriously non-numerical. While trade shows are largely a fact-free zone. Check any ten websites and see how often you are given visitor numbers, the size of an event, or its turnover. Can you tell me which are Britain’s ten largest shows? I suspect we don’t even comprehend that we are fact-free.
But in the last couple of years, we have seen statements which are, in essence, bound to deceive.
UFI claims that the UK is back to 115% of where it was in 2019 (I simply don’t believe it). It also said Germany is still running at only 80% – which is more believable. While two of our largest companies have recently said that their profits are back to where they were in 2019 (not if you discount for inflation they are not).
I recently talked about this at an AEO/AEV conference – if you were there, you don’t need to read on.
The recent “Economic Impact Study of the Exhibition Industry” by Oxford Economics fell straight into the same gaping crater.
It claims an economic impact of £10.9 bn in 2023 – but the AEV rightly points out that in 2019 the same study showed £11 billion. So had we gone slightly backwards? No, worse. Between 2019 and the end of 2023, the UK had seen 22% inflation.
So, if you discount for that, in constant money the Economic Impact of our industry in 2023 would be around 77% of its 2019 impact – which broadly tallies with a number of other analyses of the period, not least the SASiE figures. I think the 77% figure is too low – using comparable SASiE stats, the real number is probably around 85%.
But despite rigorous questioning on the point by the AEO/AEV, Oxford Economics has failed to explain where inflation comes into its conclusions.
I don’t blame any organisation from presenting information in a way which puts it in the best light – as long as it is not patently dishonest. The £10.9 bn figure was not in any way dishonest – it just failed to have a footnote mentioning the likely effect of inflation.
However, not accounting for inflation has become a plague in the exhibitions industry in the past two years. In some ways, this is understandable but not excusable – for over a decade inflation was so low as to not be a significant consideration.
But this is what inflation does….

But our industry appears not to have noticed).
Why SASiE is so good
The annual SASiE reports produced by the AEV/AEO under Rachel Parker’s determined eye are excellent. This is for a number of reasons and it is now the only place left to go for reliable year-on-year information on what is happening in the UK.
But what really makes SASiE special is that, unlike every other analysis one sees from trade organisations, from PE houses and indeed from our own larger companies, it does not deal in revenues.
This is crucial. It deals in gross and net square metres sold. It deals in visitors and delegates to events. It deals in the actual number of exhibitors. And this is what tells us what is really happening.
I won’t bore you with a dozen charts, but the one below is from the SASiE report and shows the decade long trend in GROSS SQUARE METRES sold to organisers by our biggest venues.
This is pure information. It comes from the same big venues and covers what their businesses do every year. It does not name any particular shows, nor what the venues charge for their space. It just gives raw gross square metres. It is about as reliable as any statistic in our industry can be. And some 75% of all the revenues which our industry generates comes from selling square metres of concrete.
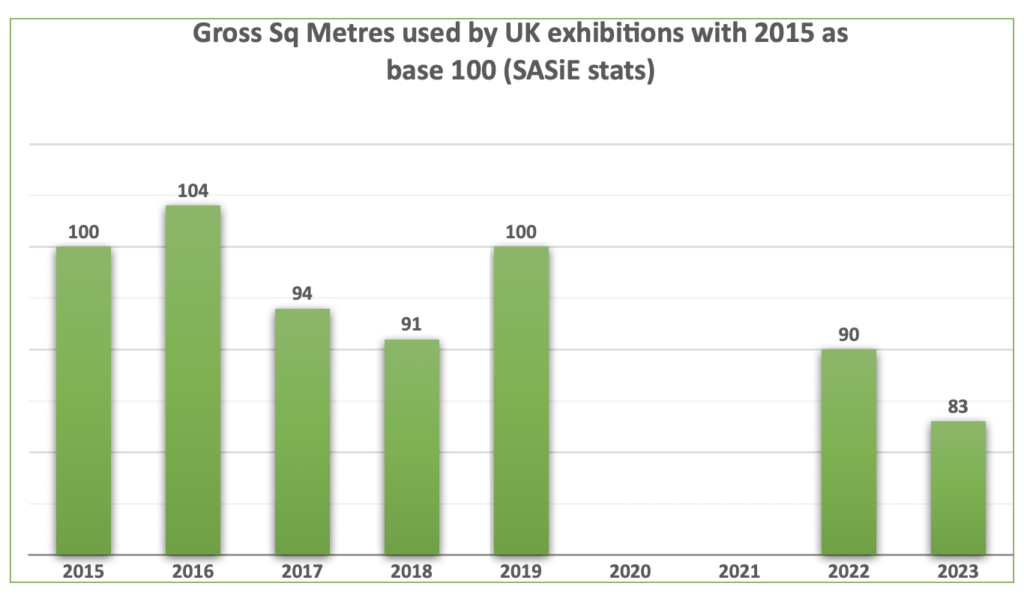
The above chart starts with 2015 and calls all the sqm rented in 2015 by venues 100 as its base for comparisons. It then gives the number of sqm compared with 2015 for each year.
As we know, the industry was coming back well until 2016, when it was hit by the lunacy that was Brexit. So far we have not recovered back to 2016 levels. And in 2023 the number of sqm rented by our major venues was just 83% of 2015 and just 87% of 2019.
In other words, despite what UFI, Oxford Economics and many of our companies are saying, by the end of 2023 we had clearly NOT recovered to where we were in 2019.
It is worth saying that, anecdotally and based on my own companies of CloserStill and Nineteen, 2024 is going well and by December 2024 I think we might see that, overall, we are getting quite close to our 2019 number.
Short of some unforeseen disaster, it is reasonable to guess that 2025 should at least match 2019 in the UK.
Why all the confusion?
Simply because our companies, and those who follow them and produce expensive “Research Documents” (often Private Equity companies), almost invariably talk revenues. Let’s use a simple example.
A show in 2019 sells 2,000 sqm at £500 per sqm. Ignoring any other income, that gives a turnover of £1m. By 2023, after 22% inflation, the show has increased its prices by (say) 15% (research strongly suggests that hardly any UK companies have kept pace with inflation in their price increases). So, a sqm now costs £575 (£500 plus 15%).
And they proudly announce that their revenues are back to 2019 levels.
But this show is following exactly the pattern we can see in the SASiE graph above. It is selling fewer sqm – 1,739 to be precise compared with 2019 (a fall of 13% in fact – pretty much what the chart predicts). But their revenue is still exactly £1m (1,739 x £575) So they proclaim: ”We are back to where we were in 2019! Champagne all round.” Rubbish I am afraid, but who is questioning it?
We cannot overstress this point….
It is impossible to overstress this crucial point. Our business is selling square metres of space and delegate revenues – and to a lesser extent sponsorship and visitor numbers. That is what we do. That’s where the money comes from. To judge how we are progressing we need to ask: “How many square metres?” or “How many delegates?” – and NOT how much did you receive in deflated pounds or dollars.
This is blindingly obvious in other businesses. If you go to shareholder meetings of Hilton or Marriott hotels, the chief financial officer will report by how much revenues were up or down in the last 12 months compared to the previous 12. But the immediate question will come: “But how many bed nights did you sell? Was that up or down?” And the same at a Coca-Cola shareholders’ meeting – “Yes, the revenues were up x% – but how many cans of Coke did you sell? In other words, are you selling more cans of Coke or less?” If Coca-Cola happens to have higher (inflated) revenues but has sold fewer cans of Coke, then the share price will suffer.
This is why SASiE is so important – it gives the answers to the questions which really matter. Are we selling more square metres? Are we attracting more visitors?
The simple answer, by the way, is less. Since 2000 we have been selling, on average, 1% less square metres each year. For visitors, we have been attracting, on average, 0.8% fewer visitors each year since 1984 and 1.8% fewer visitors each year since 2000.

A longer term view from 1984
Here is a chart of the Net Square Metres sold by exhibition companies for the 40 years from 1984 to 2023 (2020 and 2021 are excluded for obvious reasons). This is based on sources such as the “EVA FACTS”, Melville stats, AEO research, SASiE and one or two other sources.
Before you ask, this is now the only existing source of this information about the UK industry.
Four things stand out:
Firstly, and perhaps reassuringly, our industry seems to be selling around the same number of net square metres – 2,700,000 a year – as it was 40 years ago. If you want to see it from the venue point of view, then this number is around 5,400,000 gross square metres – the net/gross relationship of 50% has not changed very much in that period.
The 1992 to 2000 period was crucial for venues
The second drawdown is what happened between 1992 and 2000. This may seem a long time ago, but it was crucial in determining today’s venue landscape.
As you can see, there was a dramatic, unique rise in our industry in this period – from circa 2.4 million square metres sold to some 3.6 million.
This created a “belief” that exhibitions were a rapidly growing media from which was going to need new venues to accommodate this trend. The building of the new halls at the NEC (1999) and the opening of ExCeL (2001) were in some part a consequence of this belief (or to put it the other way round, if an investor was looking at the square metre profile from 2000 to 2009 she or he would never build a new trade show venue.)
As is often the nature of major construction projects, the trend turned at just the moment the new halls came on stream – in 2000. There is no known or convincing reason why there was this upward surge in the decade prior to the millennium, and which peaked in 2000 and then completely reversed itself in the next decade.
The chart you are looking at is a useful indicator of the impossibility of making projections about the future.
Which brings us onto the third point of interest – 2000 to 2009. This took us right back to where we had been in 1991 – a decline of some 25% in a decade. It is very, very clear from the chart how our industry was hammered by the financial crisis of 2008-2010 – and in truth we have never recovered.
But over that 2000-2009 period we cannot ignore that broadband (becoming common in 2003/2004) and then the iPhone (2008) had such a stunning effect on other media forms that we must assume that they had started to affect us as well: for the record, consumer events suffered far more than trade shows in this period.
And as a result, there was soon over capacity in the industry and this is why Earls Court was inevitably going to close.
(As a snapshot, the AEO Awards in June 2008 – before the crisis hit us – attracted 1,390 attendees, the highest figure we ever achieved. In 2009 that number was just 790 and, of the eight exhibition winners in the Hilton that night, only three still exist).
Of course, there is Brexit – Look at 2016
The fourth obvious point is Brexit. As can be seen, we’re recovering quite well between 2011 and 2016, though still some 15% below 2006, and then came Brexit in that fateful year of Johnson and Trump.
You can see clearly what happened after 2016 – though the numbers from 2019 to 2023 are obviously affected by Covid and we must wait (perhaps) for 2025 before making wider judgments.
You might ask: “Why would the Brexit vote create such a material fall?” and the answer is simply in our name. Trade shows are about trade (nothing clever there) and Brexit was clearly a vote to deliberately diminish trade between the UK and the world’s largest trading bloc (this does not imply that most of the 51.8% voting for Brexit had any understanding of this). Our graphs are a perfect indicator of the loss of economic confidence that Brexit brought to us all.
Above all else, remember that our business is all about selling square metres and attracting delegates and visitors. Don’t be fooled by any announcement which just talks about revenue or turnover – “Says who, and why are they saying it?” is always the first thing you should ask.